Procedures
The Coral Trait Database is an open source research initiative that aims to make all observations and measurements of Scleractinian corals accessible in order to more rapidly advance coral reef science. Anyone collecting coral trait data (e.g., collected in field and laboratory studies, extracted from the literature, or by other means) can join and contribute to the growing data compilation. Contributors have control over the privacy of their data and greatly benefit from being able to download complementary public data from the database in a standard format for use in their analyses. We hope that private data will become public once the contributor has published them, which will subsequently be cited when their data are used in analyses by other people. The citation system has been carefully designed to ensure full transparency about the origin of each individual data point as well as larger data compilations of other peoples' data (such as data extracted from literature for meta-analyses).
1 Mission
- Assemble disparate information on coral traits
- Provide unrestricted, open-source and easy access to coral trait data
- Avoid redundant data gathering efforts
- Facilitate and encourage the appropriate crediting of original data sources
- Engage the reef coral research community in the collection and quality control of trait data
- Facilitate reproducible science
- Do the above with a sustainable future for the database in mind, in terms of management and longevity
2 Governance
Administrator
Contact the Administrator for any information about the database.
Managerial Board
For decisions requiring a vote, at least three of the Managerial Board should agree.
- Andrew Baird
- Emily Darling
- Daniel Falster
- Joshua Madin
Editorial Board
Editors listed here are responsible for quality control of trait data. Contact a member of the Editorial Board if you would like to add a new trait to the database.
Taxonomy Advisory Board
Contact a member of the Taxonomy Advisory Board if you would like to add or edit a species.
- Danwei Huang
- Andrew Baird
Technical Advisory Board
The database relies on external people with breadth of experience and technical know-how.
- Matthew Kosnik
- Mark Schilhauer
Database programmers
Contact a Database programmer for issue related to the website or to suggest a new feature.
- Joshua Madin
3 Traits
The database was designed to contain individual-level trait and species-level characteristic measurements. Individual-level traits include any heritable quality of an organism. In the database, individual-level traits are accompanied by contextual characteristics, demarcated with  , which give information about the environment or situation in which an individual-level trait was measured (e.g., characteristics of the habitat, seawater or an experiment), and that are important for understanding variation in individual-level traits (e.g., as predictor variables in analyses). For example, an measurement of larval swimming speed was measured within the context of swimming direction and water temperature, both of which provide important information about that particular swimming speed measurement. Some
 individual-level traits are invariant across all individuals of a species (e.g., sexual system), and do not require contextual information to interpret.
In addition, we record species-level characteristics – or characteristics of species as entities (such as geographical range size and maximum depth observed). Species-level characteristics do not have contextual traits because, by definition, they apply to all individuals of the species, globally.
For simplicity, we use the single term “trait” to refer to individual-level (variant and invariant), species-level (emergent) and contextual (environmental or situational) measurements. Moreover, these traits are grouped into ten use-classes:
- Biomechanical
- Conservation
- Contextual ()
- Ecological
- Geographical
- Morphological
- Phylogenetic
- Physiological
- Reproductive
- Stoichiometric
The current list of traits can be found here.
Observations of corals and measurements of traits
Observations bind related trait measurements of the same individual. For example, observing the same coral and measuring its height and weight results in one observation with two measurements (each corresponding with a different trait of the coral). If water temperature was also measured, then this also belongs to the same observation, but as a contextual trait because it is not inherently part of the colony.
Observation-level data include the coral species, location and resource. These data are the same for all measurements corresponding to the observation. When entering or importing trait data, the following is minimally required.
- Contributor
- Access (public or private)
- Coral species
- Location
- *Resource
*Resource can be left blank for unpublished data, but data must be kept private.
Measurement-level data include the trait, value, standard (unit), methodology, and estimates of precision (if applicable). When entering or importing trait data, the following is minimally required.
- Trait
- Value
- Standard
4 Data submission
The Coral Trait Database is a research tool, not a meta-data catalog.
A meta-data repository captures dataset-level information about your data set, so that people can easily find it. Examples of meta-data repositories include DRYAD, Ecological Archives and Figshare. You are encouraged to submit data sets to meta-data repositories to help ensure their longevity and the reproducibility of the results for which the data were originally collected.
The Coral Trait Database captures data-level information so that measurements from multiple data sets can be integrated, extracted, compared and analyzed.
One way to think about The Coral Trait Database is as a very large data-set being cobbled together by the coral reef community for everyone to use, avoiding redundant efforts and speeding up science.
What information can be contributed
The database currently accepts individual-level and species-level measurements of both zooxanthellate and azooxanthellate Scleractinian corals. Data must be associated with a species name (i.e., not genus- or family-level data) and public data must be associated with a published resource (e.g., paper, monograph or book).
Data accepted:
- Individual-level raw data you collected yourself that has been published
- Individual-level or aggregated (e.g., means) data extracted from existing publications (e.g., from tables, figures or supplementary online material)
- Species-level model-derived data that has been published
- Species-level expert or group opinion data that has been published
- Unpublished data if kept private until published
Data not accepted:
- Future predictions
- Data for other taxonomic resolutions (e.g., genus or family).
Unpublished data can also be imported into the database if it is kept private. Private data can be made public once associated with a published resource. Benefits of accepting unpublished data include:
- Being able to easily download the data alongside useful public data for analysis
- Being more likely to contribute the data at end of project and improve its longevity
- Identify duplicate research efforts
To contribute data, you need to make a database account (here) and then email the database Administrator to become a contributor.
Having a primary, peer-reviewed resource is essential for maintaining data quality, contributor recognition and scientific rigor.
Adding an observation
If you are entering one or a few observations, you can use the Add Observation link in the menu bar. The spreadsheet import instructions (below) will help you understand the general data entry protocol. For instance, you need to enter the locations and resources, and also ensure the traits your require exist, before you can add an observation.
Importing a spreadsheet
Even if only entering small amounts of data, the spreadsheet submission process is recommended. A spreadsheet import is the fastest way to get data into the database. The import function accepts csv-formatted spreadsheets and runs a number of tests to make sure your data fit the database correctly (note that you can export csv-formatted files from Excel using "Save as..."). Any errors will reject the entire import and the system will attempt to tell you where the errors occur, so you can fix these errors and try the import again.
The spreadsheet you import must have a header with at least the following column names:
observation_id, access, user_id, specie_id, location_id, resource_id, trait_id, standard_id, methodology_id, value, value_type, precision, precision_type, precision_upper, replicates, notes
specie_name and trait_name can be included instead of specie_id and trait_id, respectively (or you can include both ids and names). Having the names can be useful for navigating large spreadsheets. These names must exactly reflect the names in the database, and so it is best to copy and paste names directly from the database.
resource_id is reserved for the original data resource (i.e., the paper that reports the original collection of the measurement). You can credit papers that compiled large datasets from the literature by adding a column named resource_secondary_id. resource_id and resource_secondary_id may be substituted with resource_doi and resource_secondary_doi, respectively (the doi should start with "10.", not "doi:"). The resource will automatically be added using Crossref if the doi is not already in the database.
user_id must by your own database user id (i.e., you cannot import data for other people). You can find your user id by clicking on your name in the top right corner and selecting "My Observations".
Copy and paste the above header into a text file and save as import_trait_author_year.csv, where author and year correspond with the resource (paper). Alternatively, download a CSV or Excel template.
Observation-level data
The first six required columns are associated with the observation.
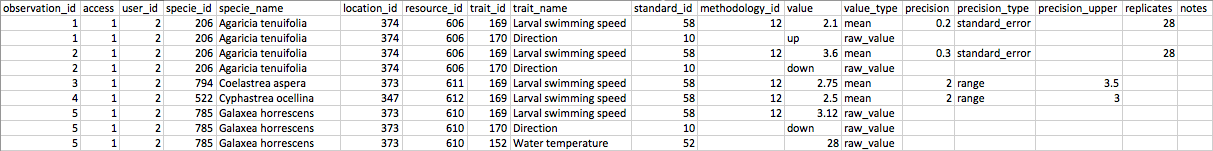
observation_id is an unique integer that groups a set of measurements into one observation. In the example below, the first two rows belong to the same observation of a coral.
access is a boolean value indicating if the observation should be accessible (0 denotes private and 1 denotes public). In the example below, the data are public.
user_id is the unique ID (integer) of the person entering the data.
specie_id and/or specie_name is the unique ID or name of the coral species of which the observation was taken. IDs occur in grey to the left of species or at the top of a given coral specie's observation page. In the example, specie_id 206 is Agaricia tenuifolia.
location_id is the unique ID of the location where the observation took place. The location_id 374 in the example is Turneffe Atoll, Belize.
resource_id is the unique ID of the resource (paper) where the observation was published. resource_id can be empty for unpublished data, in which case access must be private (0) until the data are published and the published resource is entered. In the example the resource_id 606 is Gleason et al. (2009).
Measurement-level data
The remaining columns are associated with measurement-level data. All measurements corresponding to the same observation should have exactly the same observation-level data.
Warning All measurements corresponding to the same observation should have exactly the same observation-level data. Use copy and paste to avoid making errors.
trait_id and/or trait_name is the unique ID (integer) or name of the coral trait, species-level characteristic or contextual "trait" that was measured. Trait IDs occur in grey to the left of traits or at the top of a given trait's observations page.
standard_id is the unique ID of the standard (measurement unit) that was used to measure the trait.
methodology_id is the unique ID of the methodology used to measure the trait.
value is the actual measured value (number, text, true/false, etc.). If the value is an option of a categorical trait (e.g., growth form), then the value must exactly match the value options for the trait (e.g., massive).
value_type describes the type of value. Current options are:
raw_valuefor a direct measurement,meanif the value represents the mean of more than one value,medianif the value represents the median of more than one value,maximumif the value represents the maximum of more than one value,minimumif the value represents the minimum of more than one value,model_derivedif the value is derived from a model,expert_opinionif the actual value has not been measured directly, but an expert feels confident of the value, perhaps based on phylogenetic relatedness or an indirect observation,group_opinionif the actual value has not been measured directly, but a group of experts feel confident of the value.
precision is the level of uncertainty associated with the value if it is made up from more than one measurement (e.g., mean).
precision_type is the kind of uncertainty that the precision estimate (above) corresponds with. Current options are:
standard_errorstandard_deviation95_cirange
precision_upper is used to capture the maximum (upper) value if range is used (above).
replicates is the number of measurement (replicates) that were used to calculate the value. Leave this field blank if equal to one (e.g., a raw_value).
notes is an optional field for reporting useful information about how the measurement was made.
Back-end imports
If your data is well-managed, you can ask a database programmer to upload it for you. The data will be associated with your name and made private. You are required to make the data public yourself (if desired).
Submitting data from papers
Entering published data not already in the database in strongly encouraged to improve the data's longevity and augment data analysis. A case in which this might occur is a meta-analysis. The data enterer can keep the data they submit private until their study is published.
The key objective is to extract data from resources in such a way as to avoid people ever needing to go back to the that resource again.
For example, extracting only the mean value of a trait measurement from a paper, without extracting any measure of variation or the context in which the trait was measured, will mean that the data may not be useful for other purposes. Someone else might need to go back and extract the information again, and there is a chance your initial efforts won't be cited.
Primary resources only. Often people enter data from summary tables in papers that come from other (primary) resources. It is important to enter the data from the primary resource for two reasons: (1) so that the primary resource's author is credited for their work, and (2) to avoid data duplication, where the same data are entered from both the primary and secondary resource. Secondary resources, such as meta-analyses, can be credited for for large data compilations.
Careful extraction. Copy values from tables carefully and double check. Extracting data from figures can be done with software like ImageJ or DataThief, where a scale can be set based on axis values and measurements of plotted data made, including error bars.
Gather important context. Enter contextual data as well, which might require reading the methods. This might be as simple as the depth or habitat in which corals were measured, and potentially the same for all observations. Such information is very useful. However, contextual information can get complicated quickly. For example, when the planar area (size) of a colony is measured each year for 10 years, context will include an individual identifier to capture that the same colony was measured, as well as the year to determine the order in which measurements were made. Please contact the database Administrator if you have any questions.
Quality control
There are three levels of data review.
Contributor-levelreview at time of submission, Once submitted, data are tagged as pending.Editor-levelreview. The relevant Editor/s for traits in your submission are automatically notified by email. The contributor may be contacted by the Editor if there are any issues with the submission. The Editor will approve the submission once satisfied.User-levelreview. Anyone signed-in as a database user can report an issue with an observation record, and the submitter and the Editor will be notified by email.
Error checking
Basic error checking will ensure data submissions fit into the database. Error checking will improve as different issues arise. Measurement records with the same coral species, location, resource and value will be flagged as potential duplicates.
5 Downloading data
There are a number of ways to extract data from the database
Website downloads
Data can be downloaded directly for one or more coral species, traits, locations, resources or methodologies by using the check-boxes on the corresponding pages and clicking . A zipped folder is downloaded containing two files:
- A csv-formatted data file containing all publicly available data for the selection/s, which include/s contextual data by default. You can choose to exclude contextual data, include taxonomic detail and/or retrieve global estimates only.
- A csv-formatted resource file containing all the resources (primary and secondary) that correspond with the data. Researchers are expected to cite the data using these resources correctly.
Files in csv-format can be opened in spreadsheet applications (e.g., OpenOffice, Excel, Numbers) or loaded into R using read.csv().
Controlled downloads
Every data page in the database can be loaded in four different formats: .html (default), .csv, /resources.csv or .zip. For Traits:
- https://coraltraits.org/traits/183 returns the html page for trait_id 183 (i.e., growth form).
- https://coraltraits.org/traits/183.csv returns the growth form data in CSV format.
- https://coraltraits.org/traits/183/resources.csv returns the resources corresponding with the data.
- https://coraltraits.org/traits/183.zip returns the zipped folder with both data and resource files.
Similarly for Species:
- https://coraltraits.org/species/80 returns the html page for coral_id 80 (Acropora hyacinthus).
- https://coraltraits.org/species/80.csv returns Acropora hyacinthus data in CSV format.
- https://coraltraits.org/species/80/resources.csv returns the resource list corresponding with the data.
- https://coraltraits.org/species/80.zip returns the zipped folder with both data and resource files.
The same pattern applies for Locations, Resources, Standards and Methodologies.
To control the download of contextual data, taxonomic detail or limit to global estimates (i.e., species-level data only), append the desired combination to the web address. By default, taxonomic detail is "off", contextual data is "on", and global estimates only is "off". The following examples demonstrate how to use web address syntax to control your download:
- https://coraltraits.org/locations/132.csv?taxonomy=on returns taxonomic detail, including morphological and molecular family and synonyms.
- https://coraltraits.org/locations/132.csv?taxonomy=on&contextual=off returns taxonomic detail and no contextual data.
- https://coraltraits.org/locations/132.csv?contextual=off returns no contextual data (with defaults for taxonomic detail and global estimates).
- https://coraltraits.org/locations/132.csv?taxonomy=on&contextual=off&global=on returns taxonomic detail, no contextual data, and only global estimates of traits.
Loading data directly into R
Using web address syntax described above, you can load data directly into the R statistical programming language. The benefits of directly loading data into R are that you always have the most up-to-date version of data (e.g., if you're actively entering data into the database), and you can avoid keeping local copies. The following R code will directly load all publicly available growth form data directly into R.
data <- read.csv("https://coraltraits.org/traits/183.csv", as.is=TRUE)
(as.is=TRUE prevents R from converting columns into unwanted data types, like factors)
Currently there is no bulk load for R. That is, you can only load one trait, coral species, etc., based on an id at a time. One workaround is to create a list of trait or coral ids (which never change) and either use a loop or an apply function to iteratively load and combine the data you require for your analysis.
Reshaping data downloads
Data is downloaded as a table in which the leading columns contain observation-level data and the tailing columns contain measurement-level data. Downloading species by trait matrices is not supported for two reasons. First, there are many possible ways to aggregate such a matrix and it is better to have control over these possibilities. Second, the table download retains essential metadata such as units, resources and data contributors. To convert a downloaded table into a species by trait matrix, you can use an R package like reshape2. Once this package is loaded, you can use the acast function to create your desired data structure.
The following code will include the first measurement value for a species by trait combination and is suitable for traits with one value (e.g., species-level estimates). How you aggregate traits with many values will depend on the trait.
acast(data, specie_name~trait_name, value.var="value", fun.aggregate=function(x) {x[1]})
Whereas, the code below will create a species by trait matrix with mean values for each species, which will not work if you have non-numeric traits in your dataset (e.g., growth form or mode of larval development).
acast(data, specie_name~trait_name, value.var="value", fun.aggregate=function(x) {mean(x)})
The fun.aggregate method can be changed using logical conditions to get the data structure you want (e.g., what to do if a species trait has more than one value, or what to do if a species trait has more than one value and these values are characters). Below is a generic example that returns mean values for numeric trait values and the first value for character trait values in cases where there is more than one value for a species by trait combination.
# Load the "reshape2" package for R.  This package must initially be downloaded from CRAN
library(reshape2)

# Load your csv file downloaded from the trait database
data <- read.csv("data/data_20140224.csv", as.is=TRUE)

# Develop your aggregation rules function for the "acast" function
my_aggregate_rules <- function(x) {
  if (length(x) > 1) {               # Does a species by trait combination have more than 1 value?
    x <- type.convert(x, as.is=TRUE)
    if (is.character(x)) {
      return(x[1])                   # If values are strings (characters), then return the first value
    } else {
      return(as.character(mean(x)))  # If values are numbers, then return the mean (converted back to character)
    }
  } else {
    return(x)                        # If a species by trait combination has 1 value, then just return that value
  }
}

# Reshape your data using "acast".  Fill gaps with NAs
data_reshaped <- acast(data, specie_name~trait_name, value.var="value", fun.aggregate=my_aggregate_rules, fill="")

data_reshaped[data_reshaped == ""] <- NA

# If desired, convert the reshaped data into a data frame for analysis in R
data_final <- data.frame(data_reshaped, stringsAsFactors=FALSE)

# Note that all variables are still character-formatted.  Use as.numeric() and as.factor() accordingly.  For example,
data_final$Corallite.maximum.width <- as.numeric(data_final$Corallite.maximum.width)
data_final$Red.list.category <- as.factor(data_final$Red.list.category)
6 Database releases
Releases ensure that ongoing changes to the database do not disrupt analyses. A release is a static snapshot of the database, that can correspond with a major change (that may effect compatibility with older releases), minor change (data updates for traits or new trait releases) of patches (e.g., data error fixes) (see Sementic Versioning for details). Major releases are available below as well as at Figshare in order to ensure the longevity of the data beyond the life of the Coral Trait Database. Releases are compressed folders containing two files: the actual data and the associated resources.
You can access release data directly for analyses (e.g., using R, see Download for details) using the following urls. However, be aware that you are loading the entire database release, which might take some time, and so it might be better to download a copy locally.
- https://coraltraits.org/releases/ctdb_0.1.0.zip returns the zipped folder with both data and resource files.
- https://coraltraits.org/releases/ctdb_0.1.0/ctdb_0.1.0_data.csv returns the data in CSV format.
- https://coraltraits.org/releases/ctdb_0.1.0/ctdb_0.1.0_resources.csv returns the resources corresponding with the data in CSV format.
Publishing with data from the database
If you publish a study using data from the Coral Trait Database, it is your responsibility to cite the data correctly (see License).
The database is constantly growing and changing. Therefore, if you publish a study using data from the Coral Trait Database, it is your responsibility to submit that data to the journal or a meta-data repository to ensure your results are reproducible.
7 Database design
The Coral Trait Database has been developed according to the Observation and Measurement Ontology (OBOE) that was developed at the National Center for Ecological Analysis and Synthesis (see references below). The system has been designed with reef corals in mind, but is a generic system for data in which entities are observed, and then traits of these entities are measured. The key distinction between OBOE and other observational models is that trait-entity relationships and observation context are made explicit. In other words, the database preserves meta-data about data values as well as the standard meta-data about data sets.
Several contextual constraints have been implemented in the Coral Trait Database to simplify the structure and improve speed. For example, we model only five observed entities: User, Resource, Location, Time and Coral. Measurements of "traits" can be taken of all five entities; however, we constrain the measureable traits for the first four of these entities. Measurements of "traits" for Coral are highly flexible. Also for simplicity, many contextual entities, such as "habitat" or "plot", are measured at the Coral entity level. For example, a Coral "planar area" (i.e., colony size) can be measured as expected, but so can traits for contextual entities such as "water temperature", "depth" and "habitat". Such constraints on the model can be relaxed if necessary, but are in place to improve the performance of the model for current purposes.
Database design references
- Madin JS, Bowers S, Schildhauer M and Jones M (2008) Advancing ecological research with ontologies. Trends in Ecology and Evolution. 23:159-168.
- Bowers S, Madin JS and Schildhauer M (2008) A conceptual modeling framework for expressing observational data semantics. Lecture Notes in Computer Science.
- Madin JS, Bowers S, Schildhauer M, Krivov S, Pennington D and Villa F (2007) An ontology for describing and synthesizing ecological observational data. Ecological Informatics 2:279-296.
Database monitoring
Website and data download activity are tracked using Google Analytics.
8 Database code


The database was developed using Ruby on Rails, is open source, and can be found at Github. The foundation for this web application (e.g., session and user models) was developed using Michael Hartl's Ruby on Rails tutorial.
9 License

Basically, if you enter data into the database and make it public, the data can be reused by others if they cite it correctly. Similarly, if you download and use data in an analysis to be published, you must cite primary (and, if applicable, secondary) resources correctly.
A couple of key points:
- Content must be associated with a published scientific or other scholarly research document
- Content may only be entered by an individual who represents and warrants that s/he is the creator and owner of the content or otherwise has sufficient rights to be able to make the content available under a CC0 Waiver
- The primary language of the content must be English.
- Once CC0 is applied by making data public and associating it with a published research Document, the data can not be made private again.